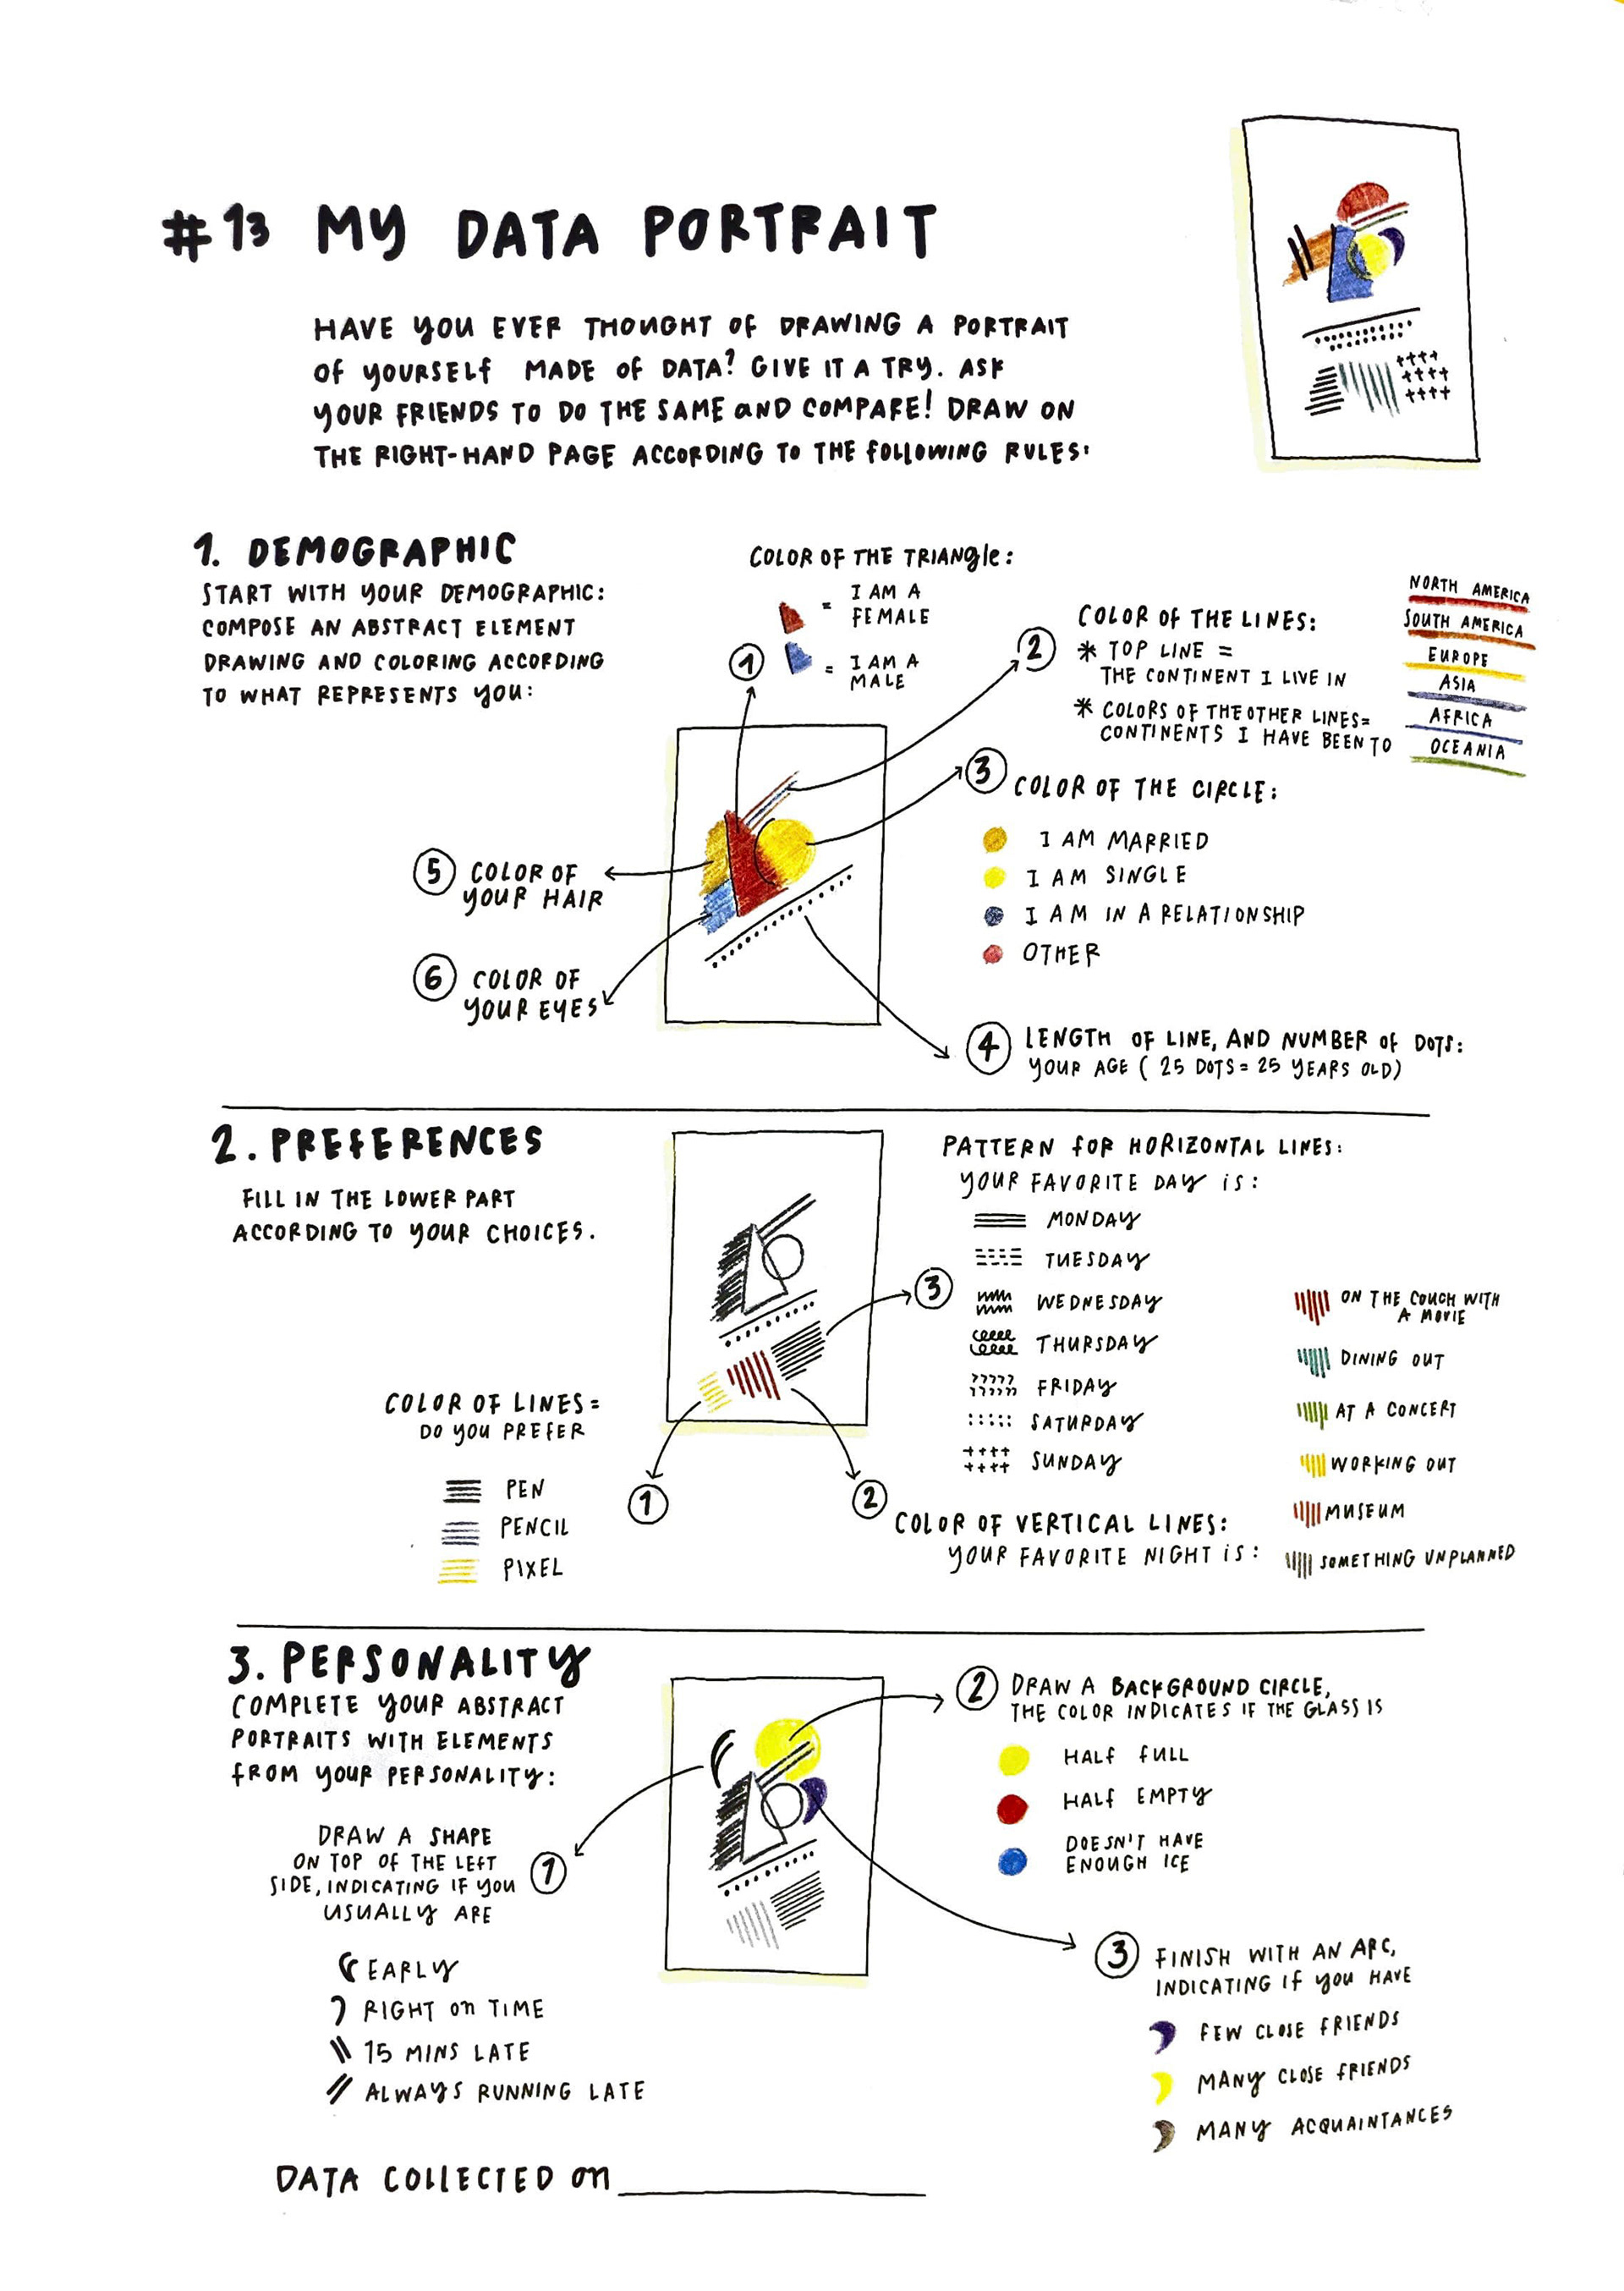
The goal of this exercise was to create a data portrait representing oneself. This was based on the data portrait exercise from Observe, Collect, Draw by Stefanie Posavec. Students were to follow the provided directions to create a group of shapes and lines that represent them. The instructions and graphic are grouped below with the exercise sketches. After the first part we were tasked with creating our own infographic utilizing design principles.
In this infographic I strove to organize information to show my identity by organizing categories from the outside to the inside. Thus the graphic starts with what is visibly apparent and moves inward to lesser known or obvious fields. I created two examples to show how size, color and tinting can show what is most important. This is exemplified especially in the black and white version where variations in contrast highlight identifying factors.
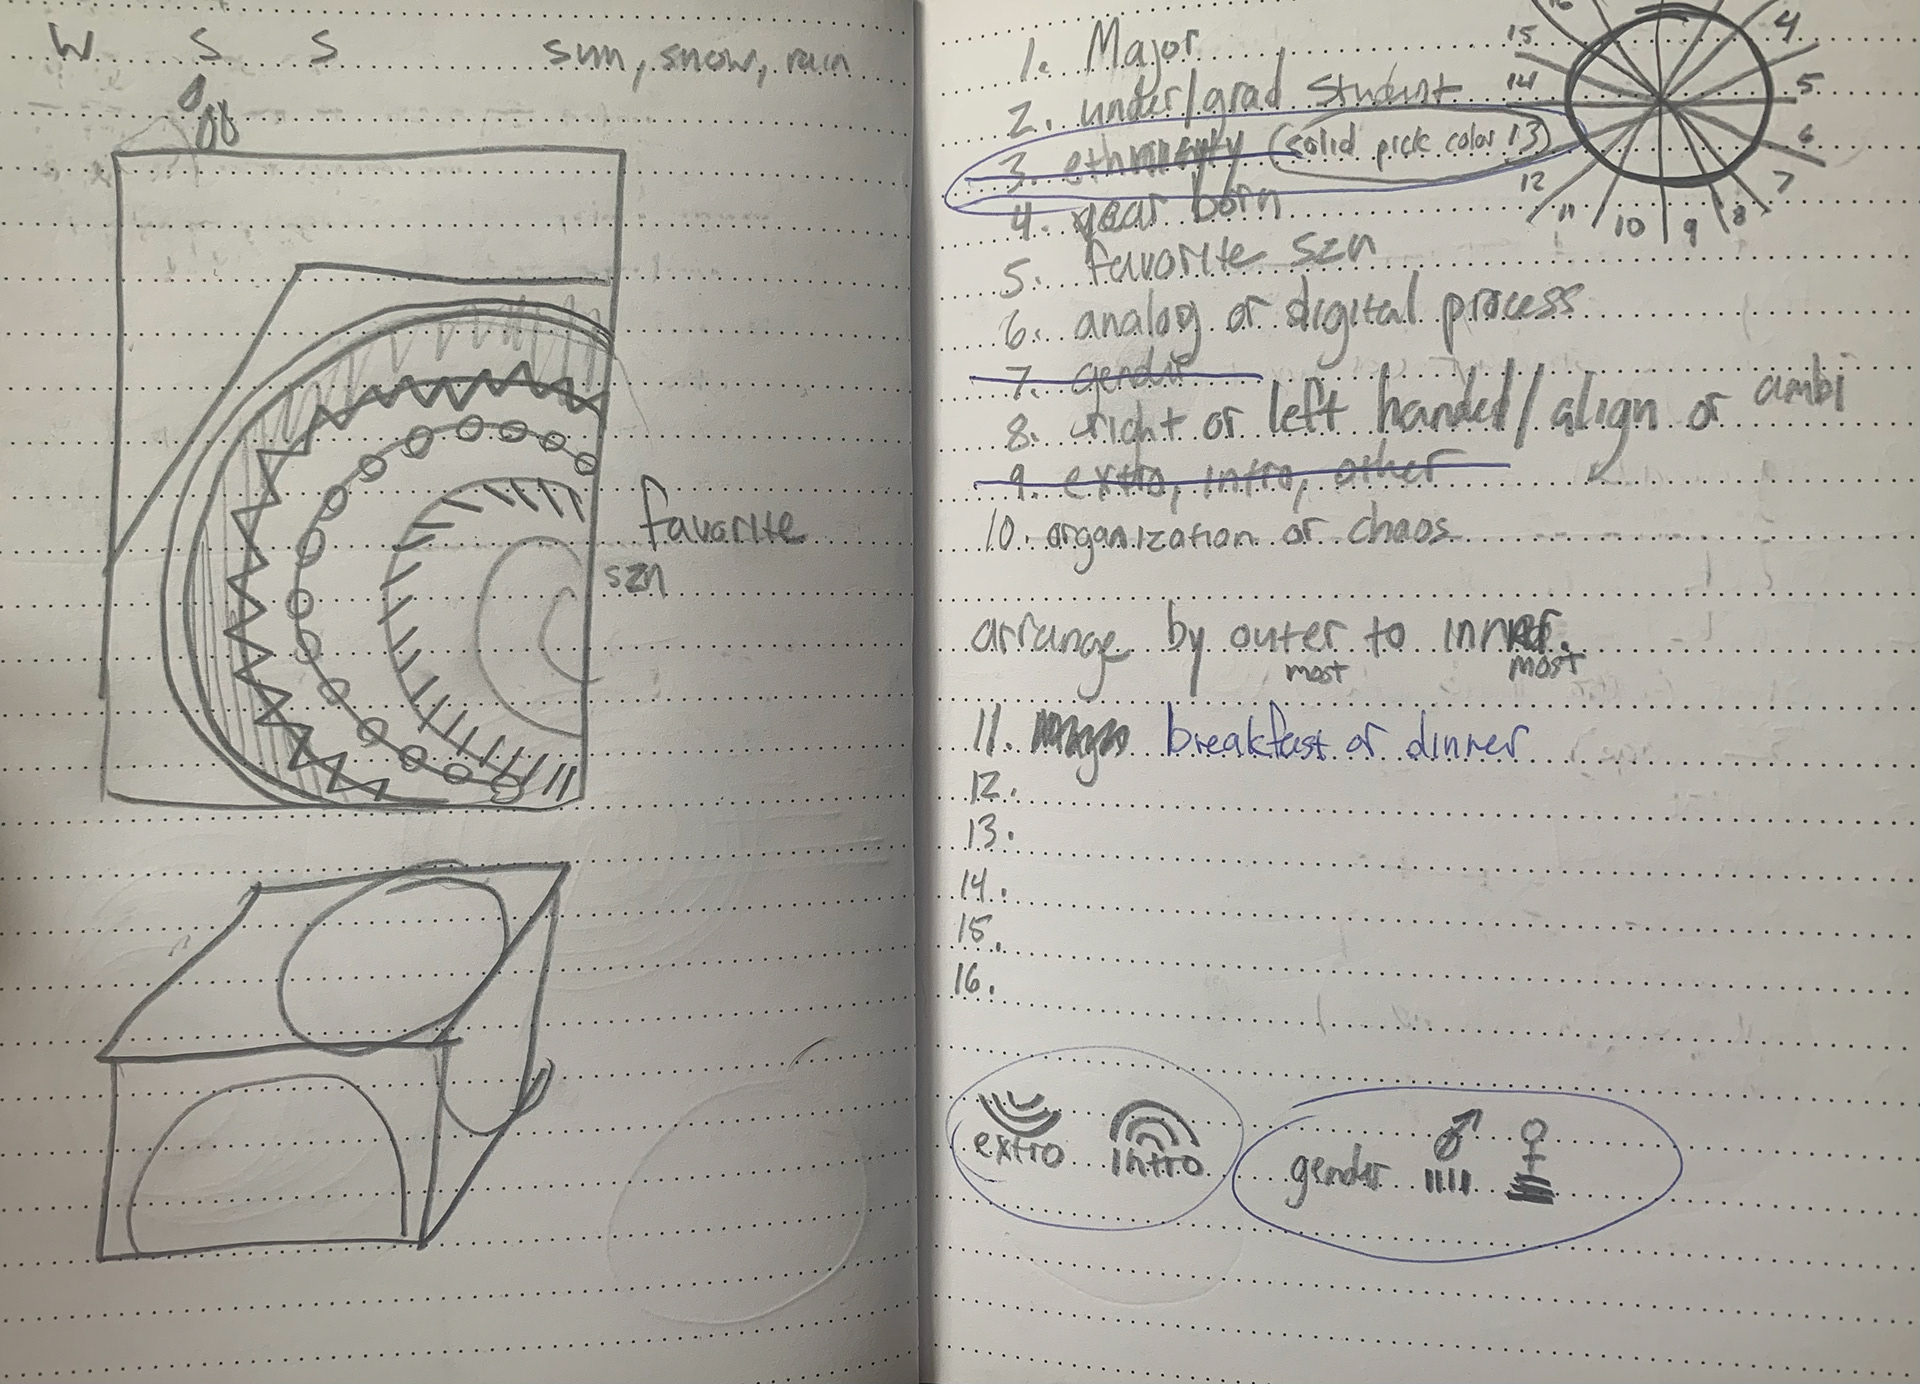
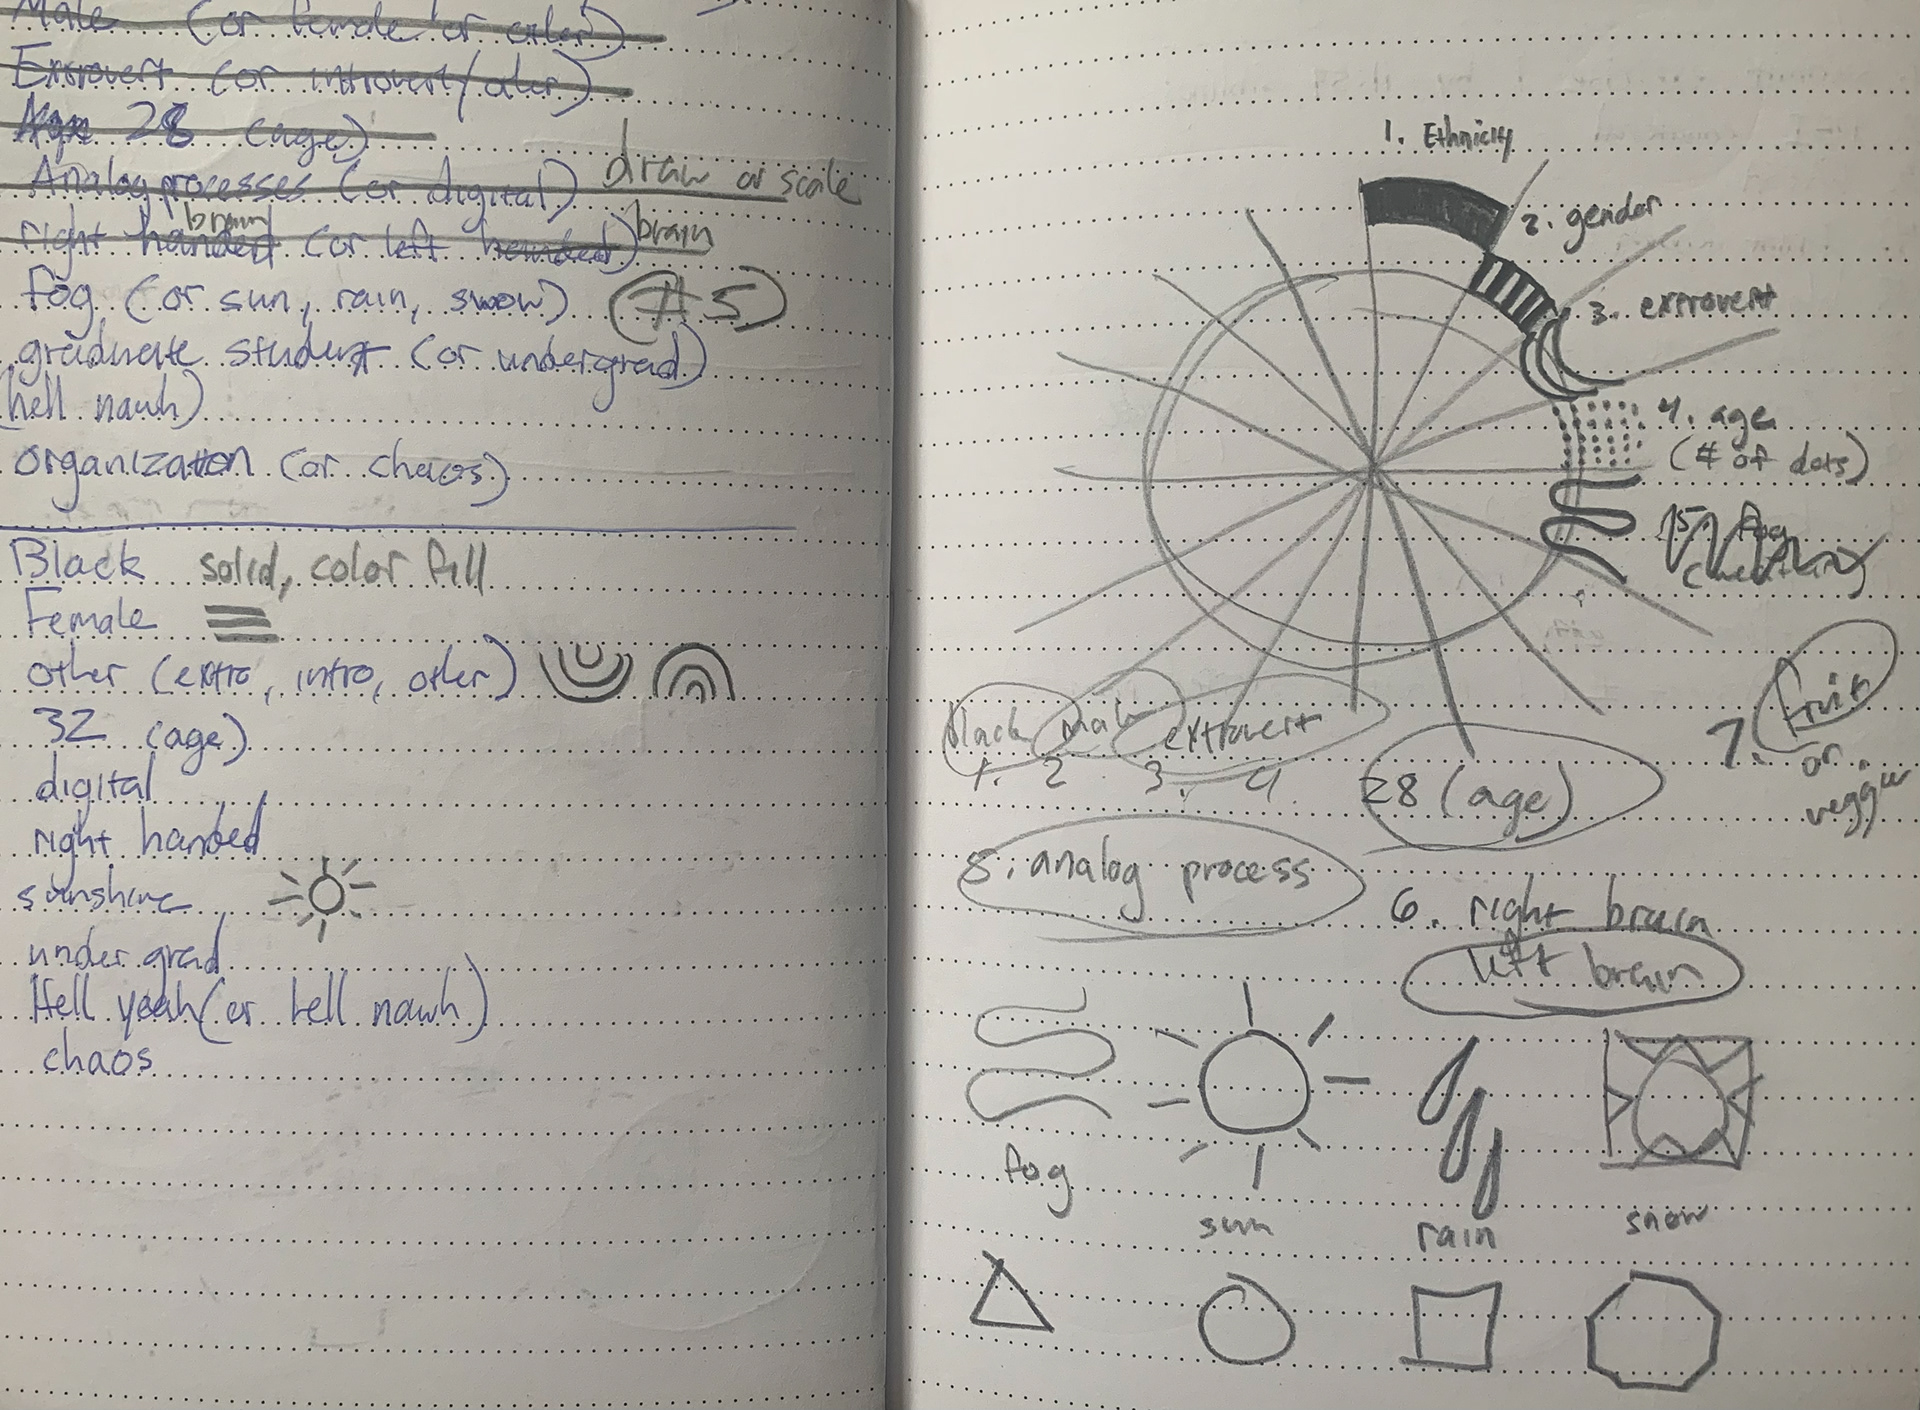
Sketches and previous iterations: